Provided by James R. Martin, Ph.D., CMA
Professor Emeritus, University of South Florida
Replacement Cost Main | Economics Related Main |
History and Development Main
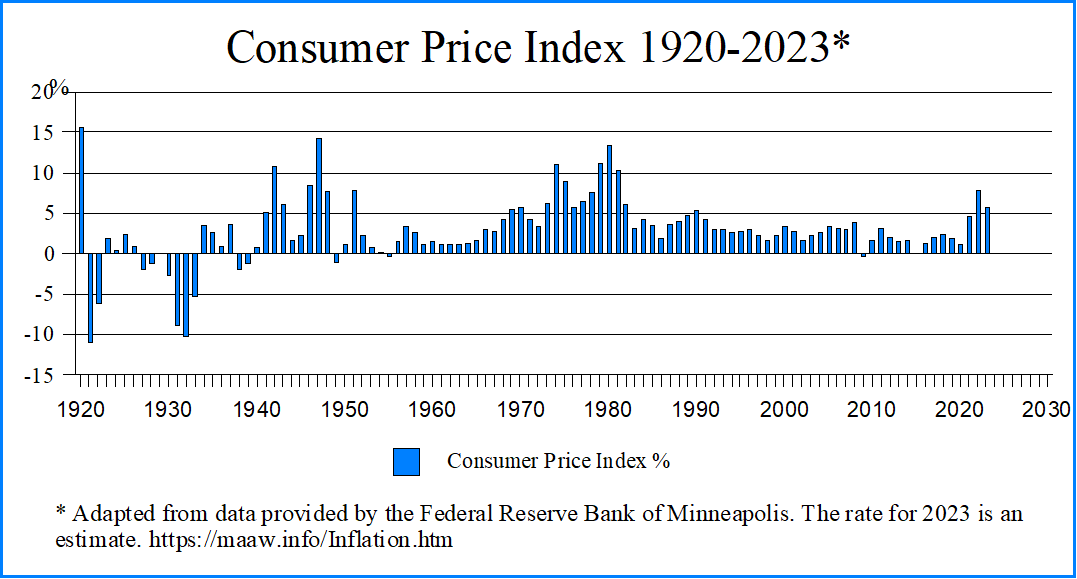
The consumer price index or CPI and the CPI-W are two popular measures of the rate of inflation. The CPI-W is the Consumer Price Index for uban wage earners and clerical workers. The two following illustrations of the CPI are based on data from the Federal Reserve Bank of Minneapolis.1

Social Security COLAs
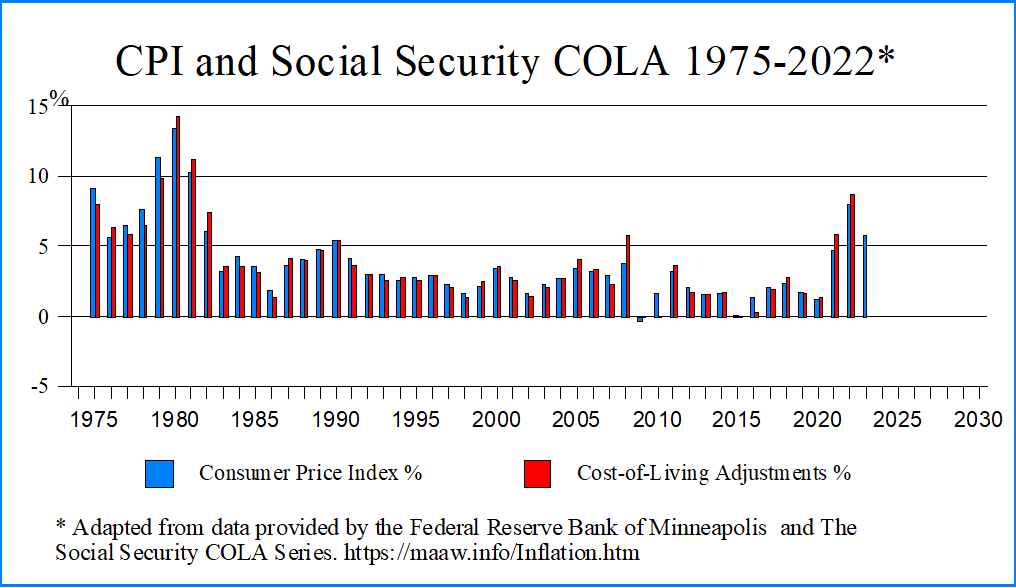
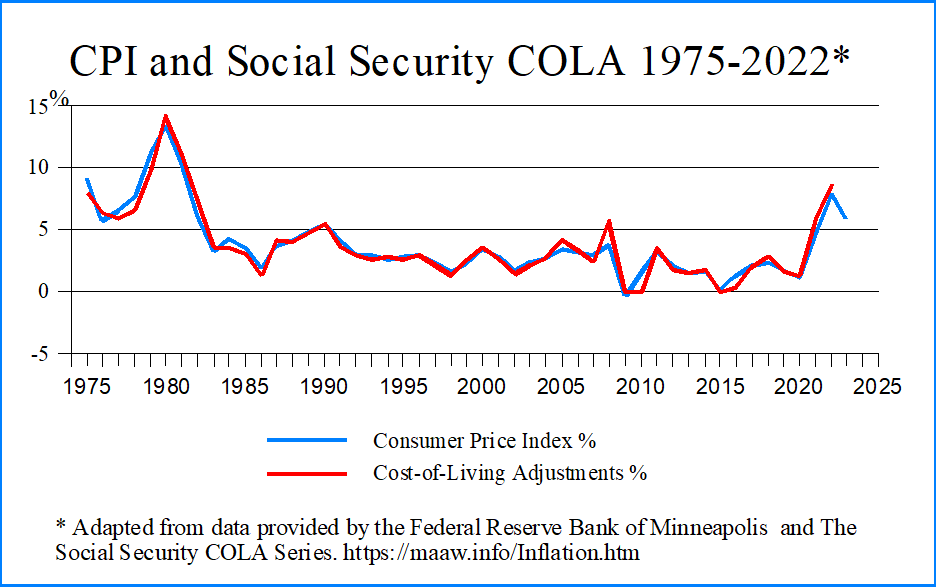
Cost-of-living allowances (COLAs) for Social Security benefits started in 1975. COLAs are based on the CPI-W. As noted above this is the Consumer Price Index for uban wage earners and clerical workers.2
The following graphic illustrations compare the CPI and CPI-W based COLA from 1975-2022. Over this 48 year period, the COLA was greater than the CPI 18 times, less that the CPI 25 times, and equal to the CPI 5 times. The CPI for 2023 is an estimate, but there is no estimate for the 2023 COLA.


1 The Federal Reserve Bank of Minneapolis
4 Inflation CalculatorRelated Summaries
Krippel, G. L. and S. Mitchell. 2011. What's your CMA worth? We show you how to estimate the lifetime value of the certification. Strategic Finance (November): 41-47. (Note).
Krippel, G. L. and S. Mitchell. 2017. The CMA advantage: An update. How much more could you earn throughout your career if you became a CMA right now? Strategic Finance (September): 38-45. (Summary).
Krippel, G. L., J. Moody and S. Mitchell. 2016. CPA credential delivers high value. Journal of Accountancy (May): 32-36. (Summary).
Martin, J. R. Not dated. 200 years of accounting history dates and events. Management And Accounting Web. (Accounting History).
Martin, J. R. Not dated. AACSB International. Salary Survey Reports: Executive Summary. AACSB. (Summary).
Martin, J. R. Not dated. IMA Salary Calculators 2010-2019. (Summary).
Schiffel, L., K. A. Smith and D. L. Schroeder. 2011. IMA 2010 salary survey: How's that recovery workin' for you? Strategic Finance (June): 26-46. (Summary).
Thurow, L. C. 1996. The Future of Capitalism: How Today's Economic Forces Shape Tomorrow's World. Chapter 9: Inflation: An Extinct Volcano. William Morrow and Company. (Summary).