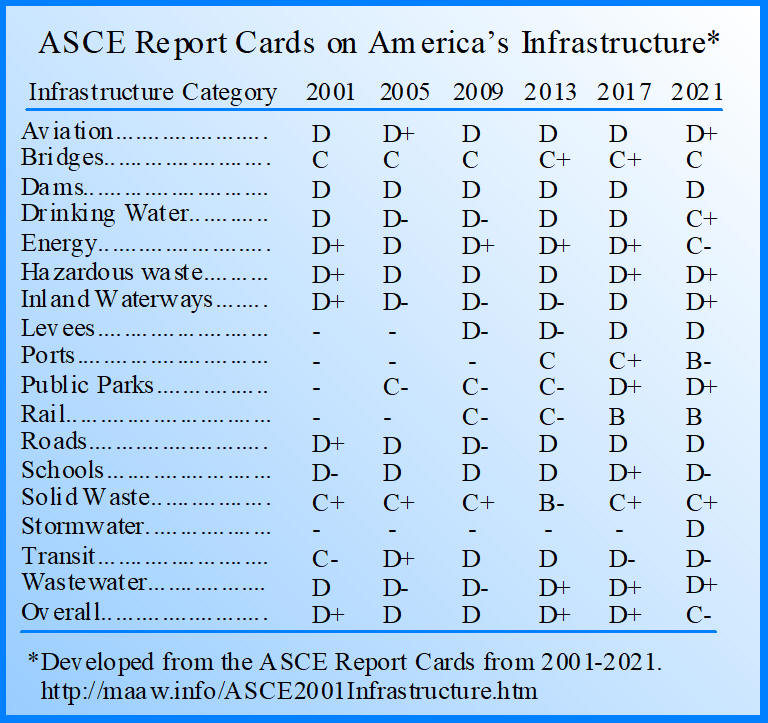
The American Society of Civil Engineers provides a comprehensive assessment of America's infrastructure every four years.
Grades for the last six reports appear in the attached graphic, and notes on the 2021 report appear below.
Deteriorating infrastructure affects our safety, overall quality of life, and makes it
more difficult for us to compete in the global economy. Grades are based on
eight criteria: capacity, condition, funding, future need, operation and
maintenance, public safety, resilience, and innovation. An A grade means
exceptional, fit for service. B is good, or adequate for now. C is mediocre, and requires attention, and a grade of D is defined
as "poor, at risk," i.e., mostly below standard,
with many elements approaching the end of their service life. For 2021 the ASCE
studied and evaluated the status of the nation's infrastructure in seventeen
categories as indicated in the exhibit below. We need a strategic and
holistic plan to renew, modernize, and invest in our infrastructure to
improve our quality of life and strengthen our international
competitiveness.
Aviation: D+ Projections prior to Covid-19 indicated that our
aviation system would have a 10-year $111 billion funding shortfall. That
gap will likely grow significantly as the travel market recovers.
Bridges: C 42% of the 617,000 U.S. bridges are at least 50
years old, and 7.5% of those (46,154) are considered structurally deficient.
A recent estimate indicated that $125 billion is needed for the nation's
bridge repair. At the current rate of investment, it would take 50 years to
make the repairs currently needed and the additional deterioration over that
time would become overwhelming.
Dams: D Dams classified as "high-hazard potential
"are
dams where failure would cause loss of human life and extensive property
damage. The Association of State Dam Safety Officials estimates that there
are 2,300 deficient high-hazard-potential dams.
Drinking Water: C- Our nation's drinking water system includes 2.2
million miles of underground pipes, but the system is aging and underfunded.
A water main breaks every two minutes. However, there has been progress as
federal financing programs expand and water utilities raise rates to
reinvest in their networks.
Energy: C- Annual spending on high voltage transmission grew
from $15.6 billion in 2012 to $21.9 billion in 2017, while annual spending
on electricity distribution systems grew by 54% over the last two decades.
However, weather has been the predominate cause of the 638 transmission
outage events from 2014 to 2018, and 92% of the outages occur along the
distribution infrastructure.
Hazardous Waste: D+ Annually, there are an estimated 35 million tons
of hazardous materials treated and disposed of in the United States.
However, progress in mitigating where hazardous waste was produced and
improperly disposed of has stalled, and the superfund cleanup site budget
has remained flat at around $1.1 billion over the past 10 years. Around 60%
of nonfederal Superfund sites are located in areas that may be impacted by
flooding, storm surge, wildfires, or sea level rise related to climate change
effects.
Inland Waterways: D+ The U.S. freight network's inland waterway (water
highway) infrastructure includes locks and dams as well as navigation
channels. There have been some improvements in the system, but there is a
$6.8 billion backlog in construction projects and ongoing lock closures that
cause delays in waterway transport. The U.S. Department of Agriculture estimates
that these delays cost the industries that rely on the waterways $44 million
per year.
Levees: D+ Seventeen million people in the U.S. live or
work behind one of our 30-40 thousand levees. The U.S. Army Corps of
Engineers estimates that $21 billion is need to improve and maintain the
moderate to high-risk levees that represent only about 15% of the known
levees in the U.S. As more extreme weather events result in flooding, it has
become more important than ever to equip communities with the resources to
make the necessary repairs to mitigate flood risk.
Ports: B- The nations more than 300 coastal and inland
ports supported 30.8 million jobs in 2018. But there is a $15.5 billion
funding gap over the next ten years for waterside infrastructure such as
dredging and landside infrastructure.
Public Parks: D+ Lack of investment in parks has resulted in
deteriorating bridges, trails, parking areas and drinking water systems and
other infrastructure. State and local parks face a $5.6 billion and 60
billion maintenance backlog respectively.
Rail: B The nation's rail network includes two
categories: Freight rail and passenger rail. Freight rail has a strong
network supported by direct shipper fees. However, passenger rail requires
federal support and this has created a $45.2 billion backlog in needed
repairs.
Roads: D Spending on highways is the largest sector of
public infrastructure spending, but 40% of the nation's roads are in poor or
mediocre condition causing motorist thousands of dollars in wasted time and
fuel each year. In addition, there are 36,000 traffic fatalities annually,
and the number of pedestrian fatalities is increasing.
Schools: D+ Although there is no comprehensive national
data on K-12 public schools, the available data indicates that 53% of public
school districts need to replace multiple building systems including
heating, ventilation, and cooling (HVAC) systems. More than one third of
public schools have portable buildings and 45% of these buildings are in
poor condition. The best estimates indicate a $38 billion annual funding gap
for public school facilities across the U.S.
Solid Waste: C+ Approximately 268 million tons of municipal
solid waste is produced in the U.S. per year: 53% goes to landfills, 25% is
recycled, 10% is composted, and 13% is combusted for energy. The disposal of
this waste is mainly supported by the private sector. However, recycling
rates are plateauing, while more contaminants are found in legacy landfills.
As a result, funding is needed to invest in a nationwide solid waste
infrastructure to focus on using solid waste as a resource, rather than as
something for disposal.
Stormwater: D Although the
development of stormwater systems has been increasing, urban flooding results in $9 billion in damages annually. Polluted runoff
impairs 600,000 miles of rivers and streams, and more than 13 million acres
of lakes, reservoirs, and ponds. Federal funding of $250 million annually leaves a
growing annual funding gap of $8 billion just to comply with current
regulations. A great deal more funding is needed to upgrade aging systems
underneath densely populated areas.
Transit: D- 45% of Americans have no access to transit. Our
existing systems are aging and $176 billion is needed to repair elements
like tracks and tunnels. This transit revenue shortfall is expected to grow
to $270 billion through 2029. As reliability issues become more frequent,
increased congestion will hamper the economy and worsen air quality.
Wastewater: D+ The nation's 16,000 wastewater treatment plants
are, on average at 81% of their capacity, while 15% have reached or exceeded
their capacity. In 2019 the annual water infrastructure capital investment
gap was $81 billion.
Overall: C- Over a ten year period, the total investment gap
is nearly $2.59 trillion.